

Introduction
The Federal Reserve has proposed to re-calibrate the U.S. GSIB surcharge framework, an additional capital requirement that only applies to Financial Services Forum members. The re-calibration of the GSIB surcharge matters because it directly affects banks’ incentives to provide and price credit, with implications for investment and the level of economic output. This blog examines how GSIB surcharges influence credit provision and, in turn, the economy. It also considers the broader implications of the GSIB surcharge on overall economic performance. Our analysis suggests that the long-run economic cost of an inappropriately calibrated surcharge can be as large as $300 billion.
The GSIB Surcharge Framework
The GSIB surcharge framework assigns a specific systemic risk score to each U.S. bank that has been identified as a global systemically important bank (GSIB). The framework uses a set of regulator-defined indicators to measure different dimensions of a bank’s systemic importance. The table below summarizes the key components of the GSIB score and provides examples of transactions that contribute to the GSIB score.
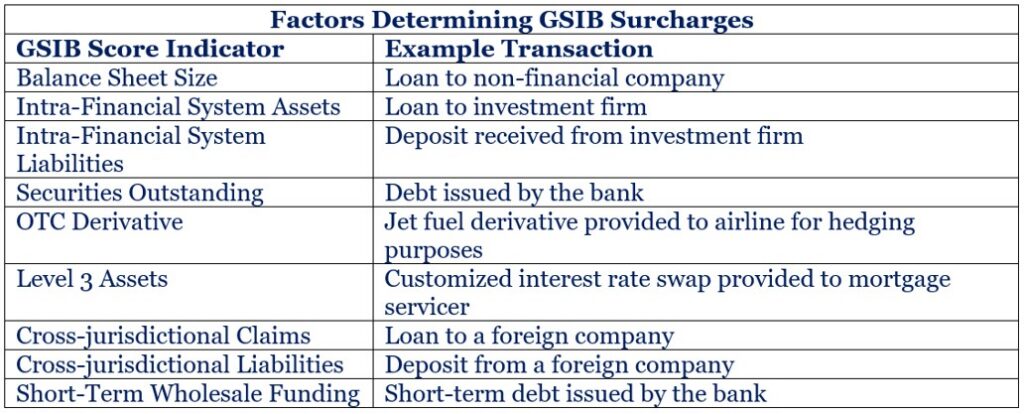
For a given GSIB, the factors are calculated across all the activities and transactions on its balance sheet, and the resulting score is then mapped to a GSIB surcharge. A single transaction can affect more than one indicator. For example, if a bank issues debt and uses the proceeds to make a loan to a non-financial company, the new loan increases the bank’s Balance Sheet Size indicator, while the debt issuance increases its Securities Outstanding indicator. Both effects contribute to the bank’s GSIB Score.
To illustrate how this works, consider two hypothetical $10 billion lending transactions. The first is a loan to a U.S. nonfinancial company that is funded by issuing additional long-term debt. The second is a loan to a U.S. investment firm, secured by Treasury securities – a type of transaction commonly known as a repo. We assess how each transaction would increase a bank’s GSIB score under 1) the current GSIB Surcharge Rule, 2) the GSIB Surcharge rule that was recently proposed by the Federal Reserve, and 3) the GSIB Surcharge rule that the Forum has proposed in response to the request for comment on the GSIB proposal.

From GSIB Score to Capital Costs
The tight link between a bank’s activities and its GSIB score and surcharge has a direct bearing on its incentive to provide credit to the economy. In the table above, we see that the two different loans increase GSIB scores by around one GSIB score point. What are the economic implications of a one point increase in a GSIB score?
Under the current rule, a 100-point increase in a GSIB score generally corresponds to a 0.5 percentage-point increase in its GSIB surcharge. As an example, a bank with a 15% capital requirement would see its required capital increase to 15.5% if its GSIB score increased by 100 points. Accordingly, one additional GSIB score point corresponds to a 0.005 percentage-point increase in the capital requirement.
An increase in required capital from, say, 15% to 15.005% may appear immaterial. In practice, however, the effect can be economically meaningful. Importantly, the increase of 0.005% applies to all the bank’s assets and not just the $10 billion loan. If the bank had total assets of $2 trillion with corresponding risk-weighted assets of $1 trillion, the bank would then need to maintain an additional $50 million in capital ($1 trillion x 0.005% = $50 million). The key point is that the higher capital requirement is applied to the bank’s entire $1 trillion of risk-weighted assets, rather than only to the $10 billion loan that resulted in an increased score. Also, note that $50 million is 0.5% of $10 billion rather than only 0.005%. The amplification from 0.005% to 0.5% results from the fact that the GSIB surcharge applies to all the bank’s assets and not just the single $10 billion loan.
Maintaining an additional $50 million in capital is costly because bank shareholders require a return on that capital. To make the loan, the bank would need to be compensated by an amount that offsets the additional cost of capital it must maintain to support the $10 billion loan.
Translating GSIB Surcharges into Borrowing Costs
How exactly does the increase in GSIB score translate into increased borrowing costs? As discussed above, the exact answer depends on the amount of additional capital generated by the transaction, the bank’s risk-weighted assets, and the return required by its shareholders. In the figure below we provide an estimate of the increase in borrowing costs that would be required for each loan based on the weighted average balance sheet profile of Forum members.
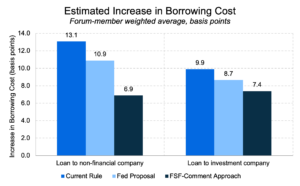
Note: Assumes a 10% annual cost of equity and a 24% tax rate. Current-rule score bands are treated as linear for purposes of estimating marginal effects.
Under the current rule, the GSIB surcharge would increase the cost of a $10 billion loan by between 10 basis points (0.1%) and 13 basis points (0.13%). For a borrower obtaining a $10 billion loan, that increase translates into approximately $10-$13 million per year in interest expense.
Increased Borrowing Costs and the Economy
When borrowing costs rise, demand for investment falls. Less investment, in turn, can diminish productivity growth and reduce overall economic output over time. The precise tradeoff between higher borrowing costs, lower investment, and reduced economic output is not easy to quantify but the qualitative relationship is undeniable. A substantial body of academic and policy research has sought to quantify these effects. In one of our prior blogs, we profiled thirteen separate research papers exploring this question. Using that research and the method outlined in the blog, we have estimated the potential loss in annual output, or GDP, resulting from the increase in borrowing costs.
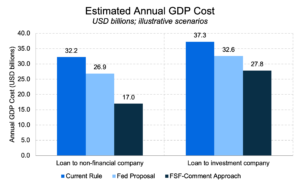
As shown in the chart, the impact of GSIB surcharges on lending translates into a loss of between $17 billion and $37 billion in U.S. GDP each year. Two points about this analysis are worth underscoring. First, the cost is stated in terms of GDP lost per year. The resulting cost will be paid every year and accumulate. Discounting the future at a rate of five percent per year would result in a one-time cost of roughly $500 billion ($25 billion discounted indefinitely at 5% per year is 20 x $25 billion). Second, the amount of lost output depends critically on the actual calibration of the GSIB surcharge rule. A final rule which penalizes bank activity less will have a materially smaller adverse effect on incentives and result in a significantly smaller economic cost. The difference between the most costly (current rule) and least costly (Forum approach) calibration is $300 billion in long-run economic cost. The magnitude of this difference underscores an important policy point: calibration matters. Small changes in regulatory design can have significant consequences for credit availability, investment, and long-term economic growth.
Conclusion
Capital requirements have a direct connection to the cost of borrowing, investing, and economic growth. The GSIB surcharge provides a particularly important example of this connection because a single bank activity can affect its GSIB surcharge, thereby increasing the amount of capital required to support all of the bank’s assets. Our analysis shows that how the surcharge rule is ultimately calibrated can have a significant impact on the economy. As regulators finalize the GSIB Surcharge rule, they should ensure that the final rule does not unduly distort the incentive to provide credit and support economic growth.