

Introduction
Quantitative liquidity requirements for large banks were put in place following the financial crisis. These rules require banks to hold more low-risk, liquid assets, such as bank reserves or short-term U.S. Treasury securities. These assets help banks meet cash outflows during periods of stress but holding more liquid assets leaves less room on the balance sheet for loans. Recent economic research quantifies this tradeoff and shows that it is economically meaningful. During the COVID-19 period, the research shows that minimum liquidity requirements became a binding constraint on bank lending. We discuss these findings, explain why they call for a fundamental reassessment of liquidity regulation, and provide additional data that reinforces the results.
Liquidity Regulation and Lending: The Tyranny of Balance Sheet Arithmetic
Prior to the establishment of post-crisis liquidity regulations, banks largely managed their liquidity needs without reference to specific, quantitative liquidity requirements. Banks maintained and managed their liquidity by holding cash, liquid bank reserves, and other high-quality liquid assets, or HQLA, sufficient to meet withdrawals and other cash needs, including the departure of a large depositor.
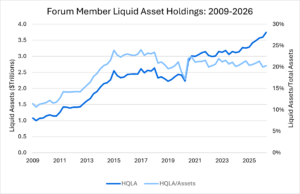
After the financial crisis, regulators introduced several quantitative liquidity requirements that set the amount of liquid assets banks needed to maintain on their balance sheets. For many large banks, these requirements substantially increased holdings of cash, bank reserves, and U.S. Treasuries. In the case of Forum members, this can be readily observed in the figure below that shows how Forum member liquid asset holdings have increased since 2009. As shown, Forum members have nearly quadrupled their liquid asset holdings in dollar terms while increasing the liquid asset share of total assets from 10 to 20 percent since 2009.
So how does a regulatory increase in liquidity requirements affect a bank’s ability to supply credit? The simplest answer is shown by looking at the impact on a bank’s balance sheet.
Consider a simplified bank that has assets of $90 in loans and $10 in liquid assets (cash). These assets are financed with $90 in deposits and $10 in equity. The figure below shows this “pre-regulation” balance sheet in the left-hand panel. Note that, as is the case for all balance sheets, total assets ($90+$10=$100) are equal to total liabilities and equity ($90+$10=$100).
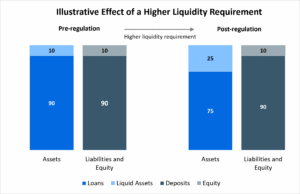
Now suppose that, because of new regulation, the bank is required to hold $25 in liquid assets rather than $10. How can the bank respond? The balance sheet on the right-hand panel shows the new “post-regulation” balance sheet that complies with the regulation.
One’s initial thought may be, just increase liquid assets from $10 to $25. But every asset on a bank’s balance sheet must be financed. If the bank keeps its total assets and funding unchanged, it must reduce loans by the exact same amount to “make room” on the balance sheet for more liquid assets. In this example, loans therefore fall from $90 to $75. As shown in the “post-regulation” balance sheet, the mix between loan and liquid assets changes – favoring more liquid assets and fewer loans. As a result, the higher liquidity requirements crowds out $15 of bank lending.
Evidence from Lending During COVID
The above discussion is stylized. In reality, there are a variety of factors that impact a bank’s liquidity demands and lending capabilities. Accordingly, it is important to look at real-world experience and data-driven analysis to inform and complement our understanding of the impact of liquidity regulation on lending incentives.
A recent research paper by economists at the Federal Reserve Board provides a useful empirical analysis of how liquidity regulation affects actual lending incentives and behavior, by examining the impact of the liquidity coverage ratio (LCR), a key post-crisis liquidity regulation, on bank lending during COVID.
The authors examined corporate credit-line drawdowns during COVID – specifically, whether and how much firms borrowed from or “tapped” credit lines that banks had previously committed to provide. Like any credit line, a bank may decide to limit the amount that can be drawn down in response to changing economic conditions. The COVID event was a classic case where banks may have reduced lending in response to the spike in economic stress and uncertainty.
The authors find that banks with larger liquidity buffers – amounts of liquid assets further above the LCR-mandated minimum- supplied more lending than banks operating closer to the regulatory minimum. The results suggest that the regulatory minimum acted as a floor. Banks operating closer to that floor had less capacity to accommodate additional credit-line drawdowns. Quantitatively, the authors find that high-buffer banks provided 10.5 percent more credit to firms than low-buffer banks (i.e. banks whose liquid assets were closer to the minimum requirement) in March 2020. The authors interpret these findings as evidence that “banks treat the regulatory minimum as a binding floor they will not breach, meaning only buffers above the threshold enable liquidity provision during stress.”
Lending Effects of the 2019 Tailoring Rule
The balance sheet logic and empirical evidence both support the view that liquidity regulations can constrain banks’ incentives to provide lending to the economy. The data below provides further support for this view.
In October 2019, bank regulators adjusted the post-crisis liquidity regulations by reducing, or “tailoring”, the LCR requirement for a group of large banks. These banks saw their LCR liquidity requirement decline from 100 percent of the full requirement to 85 percent. Larger banks, including Financial Services Forum members, remained subject to the full requirement. The rule took effect at the end of 2019, making 2020Q1 the first observation under the new requirement.
The chart below shows the liquidity buffer, defined as HQLA held above their regulatory minimums, as a share of total assets from 2018Q4 through 2026Q2. We show the liquidity buffer as a fraction of total assets to account for the fact that banks subject to the full (100%) requirement are significantly larger than those subject to the reduced (85%) requirement.
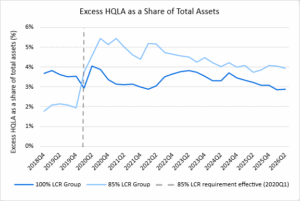
As shown in the chart, banks subject to the reduced 85 percent requirement saw a large increase in their buffer after the rule took effect – from roughly 2% of total assets in late 2019 to more than 5% later in 2020. Part of this increase follows directly from the lower requirement. By comparison, banks subject to the full (100%) requirement saw no appreciable change in their liquidity buffer, which hovered between 3% and 4% over the same period.
What happened to lending over this period? The chart below shows how each group’s average loan-to-asset ratio changed relative to its 2019Q3 level, the quarter before the final tailoring rule was announced. A value of zero means that the group’s loan share is the same as it was in 2019Q3.
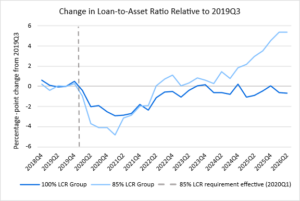
Loan-to-asset ratios declined for both groups during 2020 and the COVID period but recovered much more strongly for banks subject to the reduced requirement. By 2026Q2, the loan-to-asset ratio for the 85% group was about 5.3 percentage points above its 2019Q3 level, while the ratio for banks subject to the full 100% requirement remained about 0.7 percentage point below its 2019Q3 level. Moreover, the prior buffer chart shows that this increased lending was supported by declining buffers for the reduced requirement (85%) banks as their buffer declined from roughly 5% to about 4% over this period.
These results are in line with the previously discussed academic research and have a clear economic interpretation. Large and binding liquidity requirements reduce overall incentives for lending. Banks with lower requirements and larger liquidity buffers are better able to support lending in the real economy.
Conclusion
Robust liquidity is essential for a safe and sound banking system. At the same time, liquidity requirements can create a tradeoff between resilience and lending. If banks are required to maintain extremely large liquidity buffers against potential funding stress, less balance sheet capacity remains available to support lending.
This basic tradeoff is supported by rigorous academic research and is consistent with the recent tailoring experience. Policymakers should consider both bank resilience and credit availability as they evaluate whether and how to modernize the bank liquidity framework.