Introduction
Twelve years ago, international regulators imposed a new capital requirement on the world’s largest banks, a group of roughly 30 institutions termed Global Systemically Important Banks, or GSIBs. The capital charge, stated as a percentage of assets, was justified by the concern that distress or failure of a GSIB would cause undue disruption to financial stability and the economy. The amount of the capital requirement is based on a scoring method that serves as a proxy for systemic risk. The Federal Reserve adopted a more stringent, U.S. version of this requirement a decade ago.
In the U.S., eight banks, the Financial Services Forum members, are subject to the GSIB surcharge. A key and longstanding concern with the U.S. GSIB surcharge is that it is measured in nominal terms without adjusting for the overall size of the banking system, financial system, or economy. As a result, as the economy and financial system grow, so too do GSIB surcharges. Since 2016, the average U.S. GSIB surcharge has increased by 0.4 percentage points, which translates to roughly an additional $50 billion in required capital. In this blog we review the research findings from our recent paper that documents the source of growth in GSIB surcharges since 2016. We find that all growth in aggregate GSIB surcharges can be attributed to growth in the financial system as measured by growth in the supply of safe assets – bank reserves and U.S. Treasuries. Further, we project that absent any change in how the GSIB surcharge is calculated, GSIB surcharges will continue their steady upward trajectory over the next decade. Rising capital requirements that are not driven by actual risks but by the growth in safe and liquid assets will unnecessarily raise the cost of bank borrowing, creating an unnecessary headwind for the economy.
Diagnosing The Problem: Which One of These Is Not Like the Others?
The GSIB surcharge is determined by a regulator-defined measure of systemic risk – the GSIB score – that depends on a lengthy list of bank characteristics such as the size of a bank’s balance sheet and the amount of derivatives and trading activity conducted by a bank.
The GSIB score is calculated differently in the U.S. than in other countries. In all countries except the U.S., a bank’s GSIB score is deflated annually by the total size of the global banking system. As a result, if all banks across the globe were to increase their balance sheet by, say 10 percent, the GSIB score for all non-U.S. banks would remain unchanged.
This annual deflation is a simple and sensible policy that is akin to deflating the cost of gasoline by the level of inflation to accurately measure the real, inflation-adjusted price of gas over time. If gas prices rise three percent when inflation also rises three percent, nobody claims that we are having another OPEC crisis. Similarly, an increase in the size and scale of some banks matching the broad growth throughout the banking sector and economy does not signal an increase in “systemic risk.” The U.S. GSIB score, however, does not abide by this simple and sensible policy. The U.S. GSIB surcharge rule does not index GSIB scores for the growth of the economy and financial system. In Figure 1, we show a plot of the average score for a U.S. GSIB under our rules and the score that results from applying the rules for non-U.S. GSIBs, from 2016 through 2023. Each score is indexed to 100 in 2016 to ease comparison.
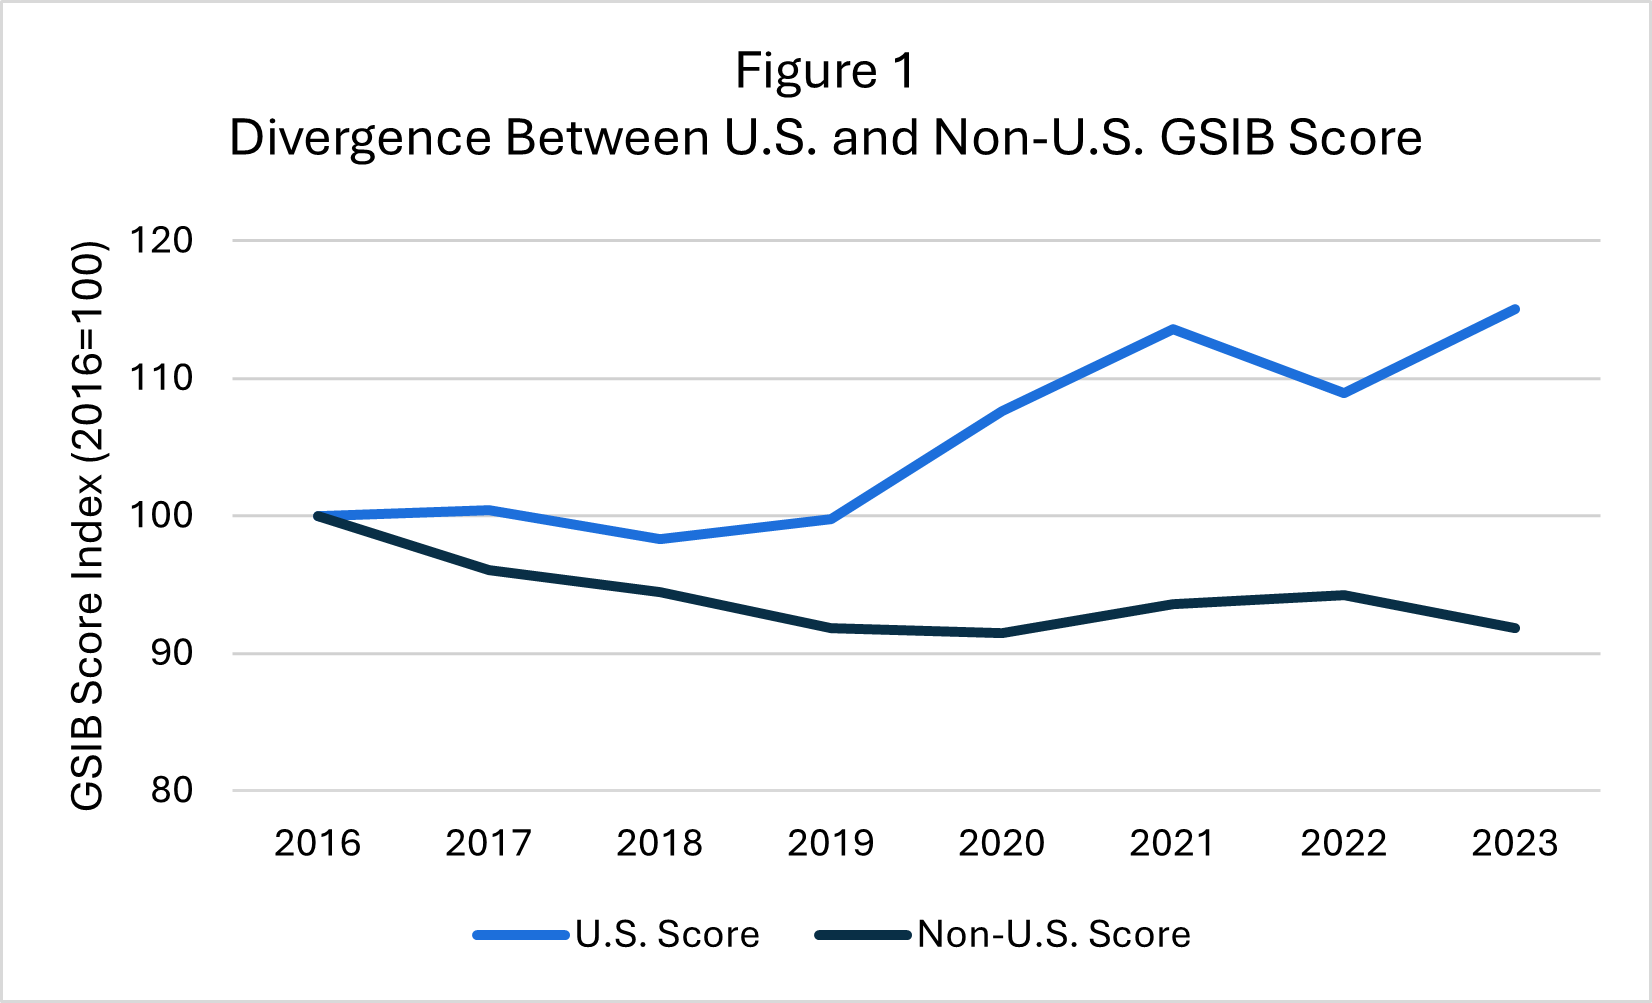
Source: BCBS GSIB Dashboard; FR Y-15
As shown in the figure, while the average U.S. GSIB score has steadily increased, especially since 2019, the non-U.S. score has actually declined. The divergence between the two scores is driven by the fact that the non-U.S. score is annually deflated for growth in the financial system while the U.S. score is not.
To be clear, as banks grow with the overall economy the dollar amount of capital they are required to maintain rises, but the capital requirement, stated as a percentage of assets, is generally invariant to a bank’s size. Indeed, if this were not the case, sooner or later every bank would have a capital requirement exceeding 100 percent.
The Upside Down: Increasing the Supply of Safe Assets and U.S. GSIB Scores
We have just shown that under global GSIB rules, the scores for U.S. banks would have declined. Instead, our rules have caused U.S. GSIB scores – and capital requirements – to increase significantly. This increase results from the fact that the U.S. regulator has not deflated GSIB scores for growth in the economy and financial system. But an important question remains, what exactly is driving the increase in the economy and financial system that is leading to higher U.S. GSIB scores and surcharges?
In our research paper we relate the increase in the size of the financial and banking system to the increase in the supply of safe assets – bank reserves and U.S. Treasuries. Both bank reserves and U.S. Treasury securities are low-risk, liquid assets that support a stable financial system. In Figure 2, we show how the supply of safe assets has evolved since 2016. The figure also presents projections for the supply of safe assets over the next decade that are taken directly from official government projections provided by the Congressional Budget Office (CBO) and the Federal Reserve Bank of New York (FRBNY).
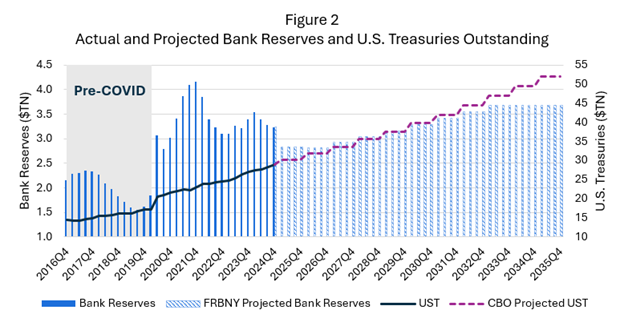
Source: FRB Reserves of Depository Institutions; U.S. Department of the Treasury: Federal Debt Held by the Public; FRBNY Annual Report on Open Market Operations; CBO The Budget and Economic Outlook: 2025 to 2035
As seen in the figure, both bank reserves and outstanding U.S Treasuries expanded greatly at the onset of the COVID pandemic and has remained elevated since that time. In the case of bank reserves (left axis), the Federal Reserve nearly doubled the level of bank reserves in a single quarter. In the case of U.S. Treasuries (right axis), outstanding U.S. Treasuries expanded by over $3 trillion in a single quarter following the outbreak of COVID. Further still, the rate of U.S. Treasury issuance post-COVID has doubled and the CBO projects that this heightened rate of issuance will persist for the next decade.
Increasing the supply of safe assets mechanically increases U.S. GSIB scores because these scores are stated in nominal terms. As the Federal Reserve increases the supply of bank reserves, banks must absorb the additional reserve supply. Likewise, as primary dealers of U.S. Treasuries, as the U.S. government increases its issuance of Treasury securities, large banks must absorb some portion of the increased supply. In addition, the supply of safe assets in the economy influences the overall amount of financial activity that naturally increases the nominal amount of activity in the banking sector. At the same time, it is important to underscore that these are nominal amounts that reflect the nominal size of the overall banking system and not any particular bank. The observed increase in U.S. GSIB scores simply reflects a larger overall financial system rather than any increase in systemic risk. Quite paradoxically, increasing the supply of safe assets increases financial system liquidity and stability, but this increase is mechanically recorded by regulators as an increase in “systemic risk.”
Oh the Places We’ll Go……?
Using the empirical link between the supply of safe assets and U.S. GSIB scores that we document in our research paper, we can answer two important questions: 1) what would have happened to U.S. GSIB scores and surcharges had the massive growth in safe assets that began with the onset of COVID never occurred? and 2) where do we expect U.S. GSIB scores and surcharges to go over the next decade given the projected path of safe asset supply?
Both of these questions are addressed in Figure 3. In the figure we show: 1) the actual path for U.S. GSIB scores (black line) and surcharges (grey shaded area), 2) the counterfactual U.S. GSIB score (blue line) and surcharge (blue shaded area) that we estimate would have occurred absent the growth in safe assets following 2019, 3) the projected U.S. GSIB score (purple dotted line) and surcharge (purple shaded area) that we estimate will occur over the next decade given CBO and FRBNY projections for the future supply of safe assets.
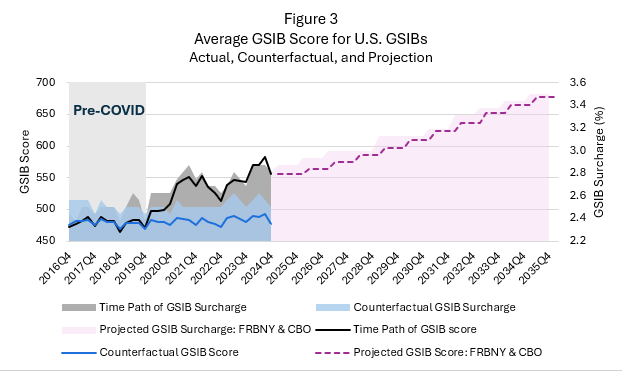
Source: FR Y-15; FRB Reserves of Depository Institutions; U.S. Department of the Treasury: Federal Debt Held by the Public; FRBNY Annual Report on Open Market Operations; CBO The Budget and Economic Outlook: 2025 to 2035
The counterfactual results (blue line and shaded area), which are produced using our model, show that without the growth in the supply of safe assets that was largely brought on by the pandemic, the average U.S. GSIB score and surcharge would have remained effectively unchanged over the 2016-2024 period. Accordingly, all growth in GSIB scores and surcharges that have been observed since 2020 has been driven by growth in the supply of safe assets and the overall financial system. This result is striking. To the extent that any other factors beyond nominal growth in the financial system influence GSIB scores, none of those factors have played any role in the observed and sustained growth in GSIB scores and surcharges since 2016.
Further, Figure 3 also shows that past is prologue in the case of GSIB surcharges. Our estimates imply that over the next 10 years, without any change to the GSIB surcharge rule, average GSIB scores will increase by another 100 points and the average surcharge will increase by another 0.5 percentage points. And once again, all of this projected growth is being driven by projected growth in the nominal size of the supply of government debt rather than any increase in systemic risk. Ironically, increasing the supply of safe and liquid assets is leading to higher surcharges that are erroneously linked to “systemic risk.”
This projection is highly concerning. Research has shown that GSIB banks reduce their lending in response to increased GSIB surcharges. Accordingly, a continued and sustained increase in GSIB scores and surcharges will only reduce support for the economy. This development would be unwelcome both because it is bad for the economy and because it would be driven by basic, underlying economic and financial growth that is wholly unrelated to any notion of systemic risk.
Conclusion
Since 2015, the Federal Reserve has overseen the implementation of the GSIB capital surcharge in concert with other global regulators. Unlike the rest of the world, however, the Federal Reserve has adopted an approach to systemic risk measurement that ignores underlying growth in the banking system and the broader economy. This deviation has created a widening rift between the U.S. and non-U.S. surcharge methodology that clearly disadvantages U.S. banks and their customers relative to their foreign peers and harms the U.S. economy. Further, left unabated, the troubling trend that has been observed since 2016 will only continue and exact an ever-rising toll on the U.S. economy. The Federal Reserve should act swiftly and decisively to arrest this perpetual growth in large bank capital requirements that is divorced from any sensible notion of systemic risk.