
Introduction
Recently, the Federal Reserve Board (FRB) embarked on an important initiative to significantly increase transparency in its stress testing program. More specifically, the Federal Reserve publicly released the models it uses to design each year’s stress scenario. The stress scenario consists of the nine-quarter path for GDP, unemployment, stock prices, interest rates, and house prices that then determine the losses experienced by banks subject to the stress test. The annual stress scenario is a critical part of the stress test that has a primary impact on large bank capital requirements. In this blog, we document a significant change in the FRB’s approach to scenario design that improves its accuracy and aligns with the findings of academic research. The transparency created by sharing its scenario design methodology with the public has resulted in an improved, more accurate methodology scenario design process that will improve the validity and legitimacy of the stress tests going forward.
Real GDP in the Stress Scenario: 2012-2025
GDP is perhaps the most inclusive and oft-quote measure of economic performance. Indeed, one common definition of a “recession” is two consecutive quarters of negative GDP growth. Accordingly, it is not surprising that the path for real GDP is a key variable in the stress test scenario. The posited path for real GDP plays an important role in determining the FRB’s estimated losses in the stress test that then translates into bank-level capital requirements.
Economists often relate GDP to unemployment via a relationship known as “Okun’s Law.” Okun’s Law posits that a rise in unemployment reduces the economy’s capacity to produce goods and services, which lowers GDP. Back in 2018, we highlighted a concern with the version of Okun’s Law used in the FRB’s stress scenario. The real GDP path in the FRB’s stress scenarios implied an Okun’s Law relationship that was considerably more severe than the Okun’s Law relationship present in U.S. data. In the figure below, we re-produce the issue that we highlighted in 2018. Specifically, the left-hand panel shows the empirical relationship between quarterly changes in unemployment and changes in real GDP that have been observed in US data since 1948. The right-hand panel shows the empirical relationship between quarterly changes in unemployment and real GDP as implied by the FRB stress test from 2012 through 2025.
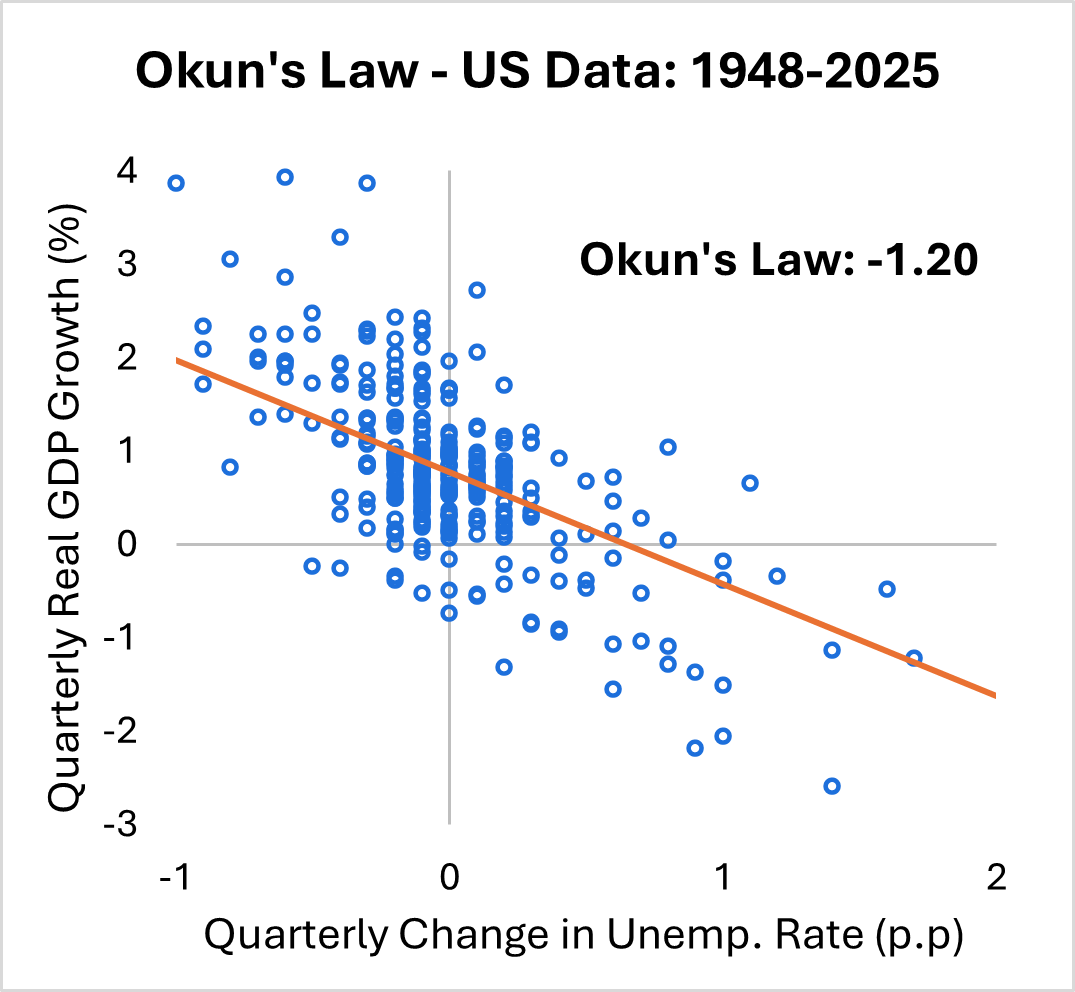
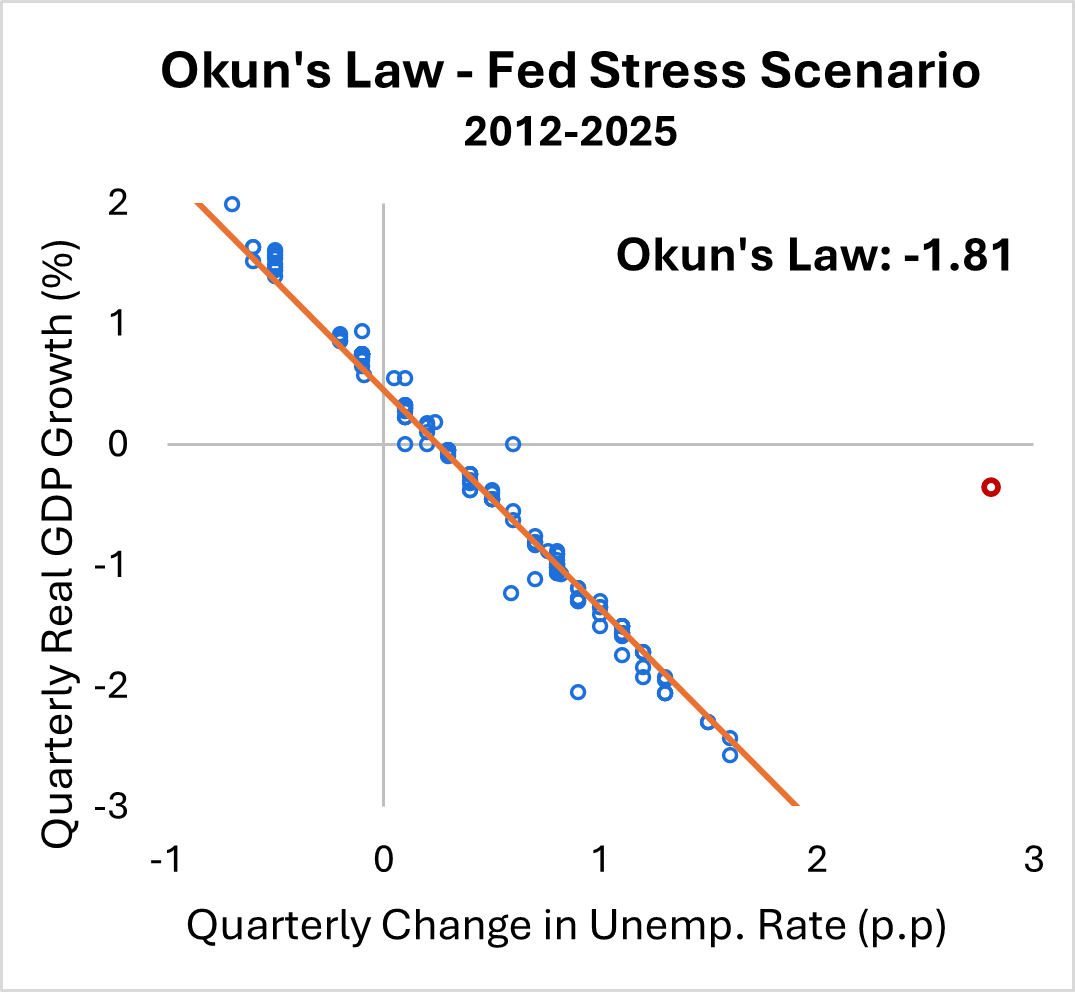
As shown in the figure, in post-WWII data, when the unemployment rate increases by one percentage point, real GDP declines by 1.2 percent. From 2012 through 2025, however, the Fed stress tests implied that a one percentage point increase in the unemployment rate resulted in a 1.8 percent decrease in real GDP. The difference between the Okun’s Law relationship present in the data and the FRB’s stress scenario amounts to a 50 percent increase in the severity of the FRB’s real GDP scenario to rising unemployment. The increased severity of the FRB’s Okun’s Law resulted in real GDP paths that were more severe than those experienced by the U.S. economy during recessions. As a result, estimated bank losses were greater and required capital levels were higher than required given the historical recession experience of the U.S. economy.
Finally, two points worth noting. First, note how the data points are tightly clustered around the Okun’s Law line in the right-hand panel. This high degree of association indicates that the severe Okun’s Law relationship is not the result of one or two outliers but is a systematic feature of the 2012-2025 FRB scenario design methodology. Second, note the red dot to the extreme right of the chart. This is a clear outlier observation that has been removed from the analysis and dates back to the 2022 scenario in which the FRB posited that unemployment would rise by 2.8 percentage points in a single quarter without any significant decline in GDP. The outlying and idiosyncratic nature of this data point strongly suggests that considerations beyond a simple Okun’s Law rule were at play, so we do not include it in our analysis.
Real GDP in the Revised Stress Tests: 2026 and Beyond
As a part of the Federal Reserve’s stress testing transparency initiative, the FRB has, for the first time, made the models underlying the annual stress scenario public. In the case of real GDP, the FRB publicly disclosed that it plans to use a version of Okun’s Law to specify the path of real GDP in all future stress scenarios, “the Board determines real GDP using a version of Okun’s Law…Okun’s Law is a well-established regularity linking fluctuations in the unemployment rate to those of output.”
In discussing the implementation of Okun’s Law, the FRB notes that the key parameter of interest is the sensitivity of real GDP to changes in the unemployment rate. The model documentation presents estimates using U.S. data that range between 1.1 and 1.5. Importantly, these estimates are considerably smaller than the empirical Okun ‘s Law sensitivity of 1.8 that characterized the FRB real GDP scenario from 2012 through 2025. In discussing the critical sensitivity parameter, the FRB settles on a value of 1.4, which is at the high end of the range of presented estimates but is broadly consistent with U.S. data over the past 50 years.
Below, we show two figures that underscore how the 2026 FRB real GDP scenario path differs from the 2012-2025 experience. The left-hand panel shows the new Okun’s Law relationship (the solid line) along with the nine quarters of unemployment and real GDP from the 2026 stress scenario. Superimposed over this plot is the Okun’s Law relationship (dotted line) that characterized the FRB stress scenario from 2012-2025. The right-hand panel shows the real GDP path from the 2026 scenario (blue line) and the real GDP path that would have resulted had the FRB used the 2012-2025 Okun’s Law relationship to specify the 2026 real GDP path (orange line).
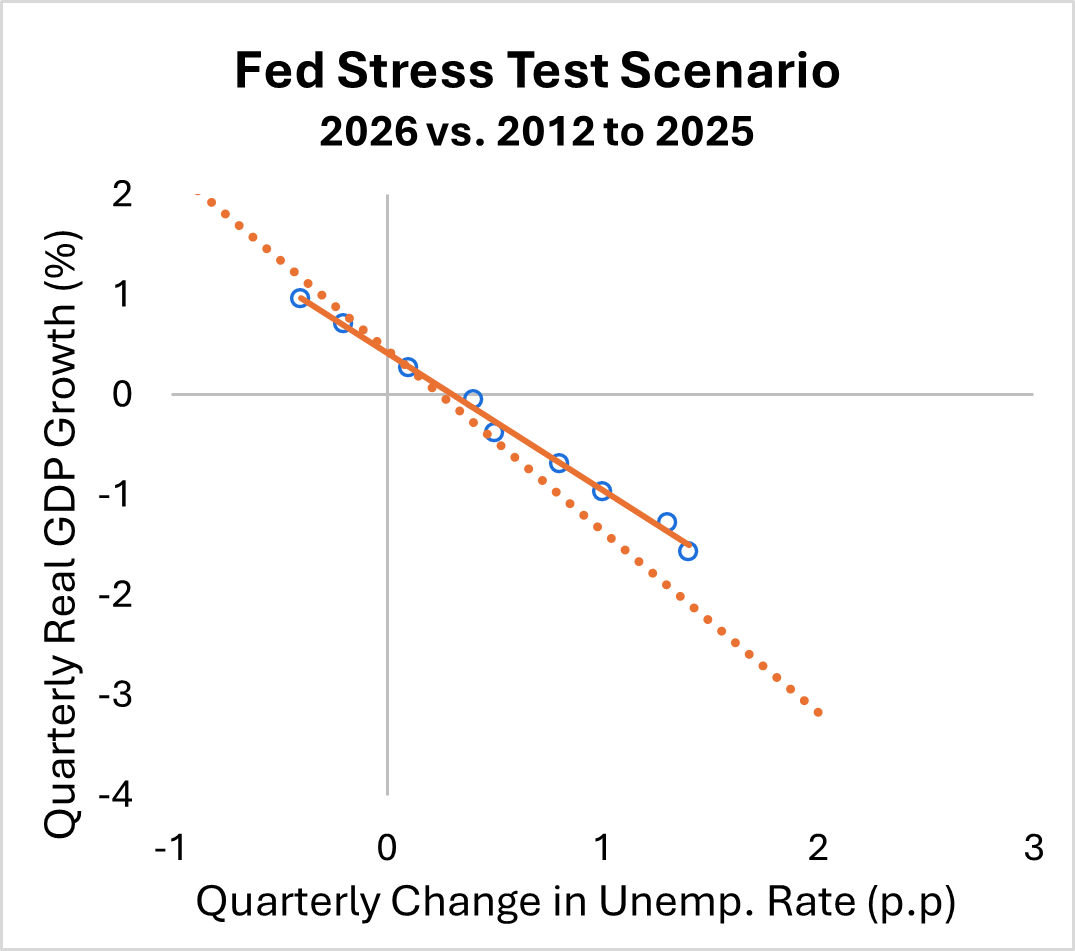
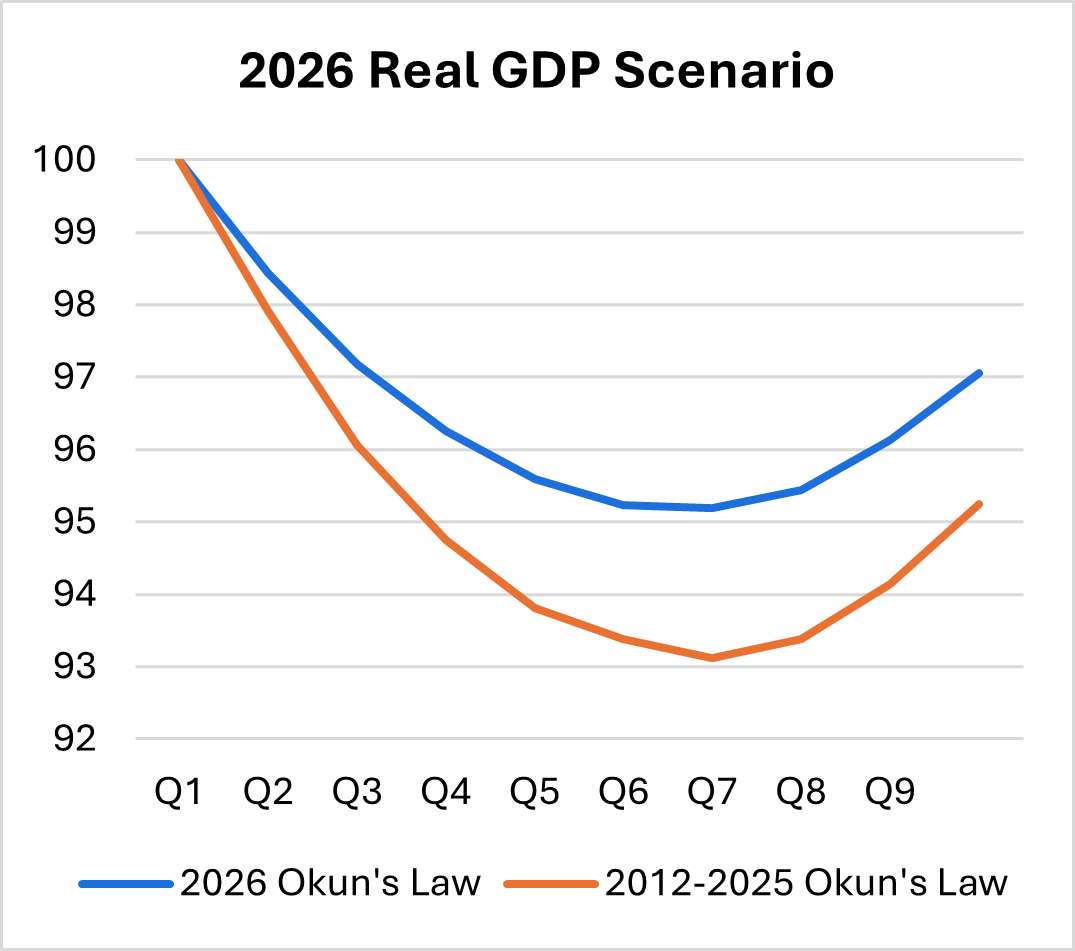
As shown in the figure, the 2026 real GDP scenario represents a significant departure from prior practice. Pre-transparency initiative, the FRB would have posited a much steeper and longer-lasting decline in real GDP that is at odds with data from the U.S. economy and the findings of academic research.
This change to the scenario design process is a valuable improvement to the FRB’s stress test methodology because it is inherently data-based, it conforms to the experience of the U.S. economy, and is guided by the findings of rigorous, academic research. Above all, the new methodology is transparent and permits the public to understand how the FRB determines each year’s stress scenario in the stress test. This transparency is critical because the stress tests have a real and significant impact on bank capital requirements, which themselves influence how banks allocate scarce capital to support the economy.
Conclusion
This year the Federal Reserve has begun an important initiative to improve the transparency of its stress testing regime. It has often been said that “sunlight is the best disinfectant,” and the results of the transparency initiative as they relate to the specification of real GDP in the annual stress scenario bear this out. The Okun’s Law relationship used to determine the path for real GDP in the 2026 stress test represents a significant change from past practice that is data-based, consistent with the experience of the U.S economy and aligned with rigorous academic research. This change will result in more accurate stress tests that will improve the legitimacy and validity of the Federal Reserve’s stress testing framework while ensuring that banks are robustly capitalized against a severe macroeconomic downturn.